Investing in the people
By making higher budgetary allocation to the social sector, the ruling parties can not only alleviate the prevailing socio-economic hardships of the people, but also strengthen their own political relevance as there is a direct trade-off between welfare measures and decisive votes

Last month, India formed a new coalition government under the National Democratic Alliance (NDA), where no single party could win the minimum 273 seats to govern the country for the next five years. Meanwhile, this week, two reports on India’s socio-economic condition indicate a very alarming situation prevailing in the country presently.
The first report, ‘Annual Survey of Unincorporated Sector Enterprises (ASUSE)’ and the comparable 73rd round survey in 2015-16 by the National Statistical Office (NSO) showed that unincorporated enterprises in the manufacturing sector lost nearly 1.8 million establishments and shed 5.4 million jobs between July 2015-June 2016 and October 2022-September 2023. An estimated 17.82 million unincorporated enterprises operated in the manufacturing sector in October 2022-September 2023, nearly 9.3 per cent down from 19.7 million unincorporated enterprises in July 2015-June 2016. Similarly, the number of workers engaged by these establishments declined by nearly 15 per cent to 30.6 million (2022-23) from 36.04 million (2015-16), reported Business Standard.
A recent report by the World Inequality Lab titled, ‘Towards Tax Justice and Wealth Redistribution in India’, revealed that India’s income and wealth inequality, which declined post-independence, began to rise in the 1980s and has soared since the 2000s. Between 2014-15 and 2022-23, the increase in top-end inequality has been particularly striking in terms of wealth concentration. The top 1 per cent of income and wealth shares are now at their highest historical levels. Specifically, the top 1 per cent control over 40 per cent of total wealth in India, up from 12.5 per cent in 1980, and they earn 22.6 per cent of total pre-tax income, up from 7.3 per cent in 1980. This dramatic rise in inequality has made the “Billionaire Raj,” dominated by India’s modern bourgeoisie, more unequal than the British Raj. It places India among the most unequal countries globally, reports NDTV quoting the original study.
It also reveals that 88.4 per cent of billionaire wealth in India is concentrated among upper castes (UCs). Scheduled Tribes (STs), among the most marginalised communities, have no representation among the wealthiest Indians. This disparity extends beyond billionaire wealth; upper castes hold nearly 55 per cent of the national wealth, according to the All-India Debt and Investment Survey (AIDIS) for 2018-19. Caste continues to influence access to education, healthcare, social networks, and credit—all essential for entrepreneurship and wealth creation. Historically, Dalits were forbidden from owning land in many regions, severely limiting their economic advancement.
In addition to the above study, the ‘State of Working India, 2023’ report by Azim Premji University highlights that Scheduled Castes (SCs) and Scheduled Tribes (STs) are underrepresented as enterprise owners relative to their workforce participation. While SCs make up 19.3 per cent of the workforce, only 11.4 per cent own enterprises. For STs, who constitute 10.1 per cent of the workforce, only 5.4 per cent are enterprise owners.
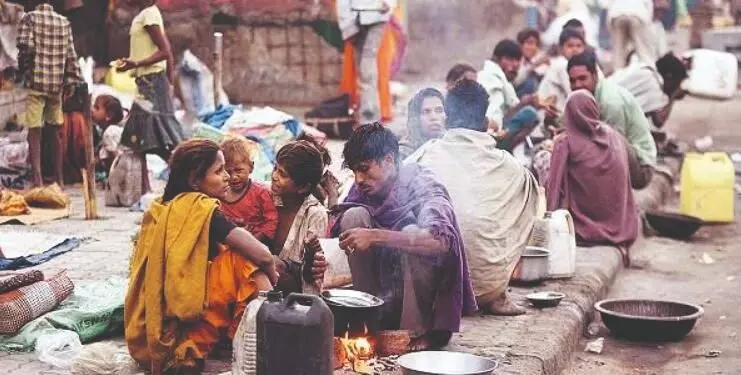
It may be recalled that according to ‘The National Multidimensional Poverty Index: A Progress Review 2023’, the country registered a decline of 9.89 percentage points in multidimensionally poor from 24.85 per cent in 2015-16 to 14.96 per cent in 2019-2021. This indicates that in 2019-21, around 15 per cent of 140 crore, 21 crore Indians, were multidimensionally poor. This is a huge number, equal to that of the total population of the UK, Germany and France. However, there are reasons to fear that during the last four years, the number of multidimensionally poor in India has increased.
Under such a condition, budgetary allocation by the state in various welfare schemes, targeting the vulnerable sections of the citizens, is very important.
Declining allocation for welfare schemes
During the last one decade, there has been a discernible dismantling of the welfare and social security framework that provides socio-economic protection to crores of citizens. A study by Ashmi Sharma and Nancy Pathak (2023) reveals that since FY 2014-15, there has been a 150.88 per cent increase in the Union Budget outlay. Nonetheless, during this period, the share of budget allocations dedicated to social security schemes, with the exception of COVID-19, in relation to the overall budget, has seen a downward trend. Budgetary allocations over the last nine years for programmes such as the Mahatma Gandhi National Rural Employment Guarantee Act (MGNREGA), the National Social Assistance Programme (NSAP), programmes under the National Food Security Act (NFSA), and the National Health Mission (NHM) confirm this trend. Additionally, in many instances, budget allocations for social security schemes are less than the revised estimates from the previous year – signalling the gap between the financial requirement necessary to sustain these schemes and the actual allocation made by the government, the study reveals. Few examples:
The allocation made to MGNREGA, as a share of the overall budget, has declined from 1.85 per cent in FY 2014-15 to 1.33 per cent in FY 2023-24. This allocation is the lowest that has ever been made to the MGNREGA programme, which is an economic safety net for millions of poor. The budget estimates at Rs 60,000 crore in FY 2023-24 saw a drastic 33 per cent reduction from the revised estimates of Rs 89,400 crore in FY 2022-23. The World Bank recommends that for the programme to run effectively, the allocation for MGNREGA should be at least 1.6 per cent of the total GDP, this figure currently stands at an appalling 0.198 per cent.
The budgetary allocation for NSAP has remained almost stagnant. The percentage share of expenditure allocated in the overall budget has decreased from 0.58 per cent in FY 2014-2015 to a mere 0.21 per cent in the 2023-24 budget. Even more concerning is that the entitlements received under the NSAP programme have remained unchanged since 2007 even as cost of living has surged ahead. A meagre sum of Rs 200-300 per month for the various pensions covered under the programme is nowhere adequate for an individual to survive.
NFSA, which, through its various programmes, provides food security and nutrition to economically vulnerable households, women, and children, faced maximum budget cut. With the exception of COVID-19, the percentage share of the budget allocated towards food subsidies decreased from 6.4 per cent in FY 2014-15 to 4.38 per cent in FY 2023-24. This reduction is primarily due to the discontinuation of the Pradhan Mantri Garib Kalyan Anna Yojana (PMGKAY) in January 2023, which resulted in a 50 per cent reduction in ration entitlements for 81 crore people. Other schemes under the NFSA, the Mid-Day-Meal Scheme, renamed PM Poshan in 2021, have seen a reduction in their share of allocation within the overall budget, decreasing from 0.73 per cent of the total budget to 0.25 per cent in FY 2023-24.
Social sector expenditure of states: the silver lining
The RBI report ‘State Finances: A Study of Budgets of 2023-24, Statement 32’ reveals (refer to table 2) that Social Sector Expenditure of all the States and UTs of total disbursement has increased from 33.9 per cent in 2006-07 to 41.8 per cent in 2022-23. However, allocation between 2013-14 and 2018-19 has remained nearly stagnant at around 40 per cent.
On the basis of data provided in the UNDP, National Multidimensional Poverty Index-A Progress Review 2023 report, we have identified 11 states where the percentage of total (head count) reduction of multidimensional poverty (MDP) of population was over 9 per cent between 2015-16 & 2019-21 (see table 1). The table shows during this period, the maximum per cent of MDP to total population was reduced in Bihar, followed by Madhya Pradesh and Uttar Pradesh. In West Bengal, 9.4 per cent of the population came out of MDP.
If we analyse the population density of these states, Arunachal Pradesh and Nagaland are very sparsely populated. Due to this, their per capita incomes are also relatively higher compared to nine other states as identified in table 1. Here we shall analyse the performance of nine larger states in addressing poverty. Please refer to table 1 & 2 for data.
- Bihar: During 2015-16 and 2019-21, MDP came down from 51.89 per cent to 33.74 per cent—a reduction of 18.15 per cent. The most noteworthy feature is that since 2006-7, Bihar had a social sector expenditure share in total disbursement of over 40 per cent and during 2013-14 to 2018-19, the share was increased substantially to nearly 49 per cent, subsequently increasing to over 53 per cent. During 2024 elections, NDA won the Bihar elections.
- Madhya Pradesh: Between 2013-14 and 2018-19, the social sector allocation increased from 39.8 to 42.0. NDA has won the election.
- Uttar Pradesh: Between 2013 -14 and 2018-19, the social sector allocation was cut from 38 per cent to 34.4 per cent. Subsequently it has been raised to over 40 per cent. Though NDA has won a higher number of seats, it faced a tough competition.
- Odisha: Though the Odisha government has spent substantially in the social sector, the ruling BJD has lost the election. Maybe some other non-economic factor has gone against BJD.
- Rajasthan, Chhattisgarh, and Assam have favoured the ruling party, maybe due to high spending in the social sector.
- Jharkhand: Another example is Odisha where, in spite of consistently higher expenditure on the social sector, the ruling party has lost.
- West Bengal: WB has increased its social sector spending from less than 40 per cent in 2006-7 to over 50 per cent in 2022-23. This is the only state in list where the ruling non-NDA party could substantially increase its seat share in the last election.
Observations
In the socio economic crisis situation India is facing now, the distinction between freebies and welfare schemes are blurred. As senior Supreme Court advocate Sanjay Hedge rightly says, it is not easy to define a freebie. “If school-going girls get free bicycles, for instance, there are several fiscal and social benefits which justify this measure”. There are no judicially manageable standards for distinguishing between good freebies and bad freebies.
Our brief analysis reveals that higher budgetary allocations in the social sector—expenditure on social services, rural development and food storage and warehousing under revenue expenditure, capital outlay and loans and advances by the state governments, are not only good economics, it’s also good politics.
Though election results depend on many factors, various welfare schemes for the socially and economically disadvantaged citizens, who are huge in number, probably helps the ruling party to acquire their support.
Views expressed are personal


